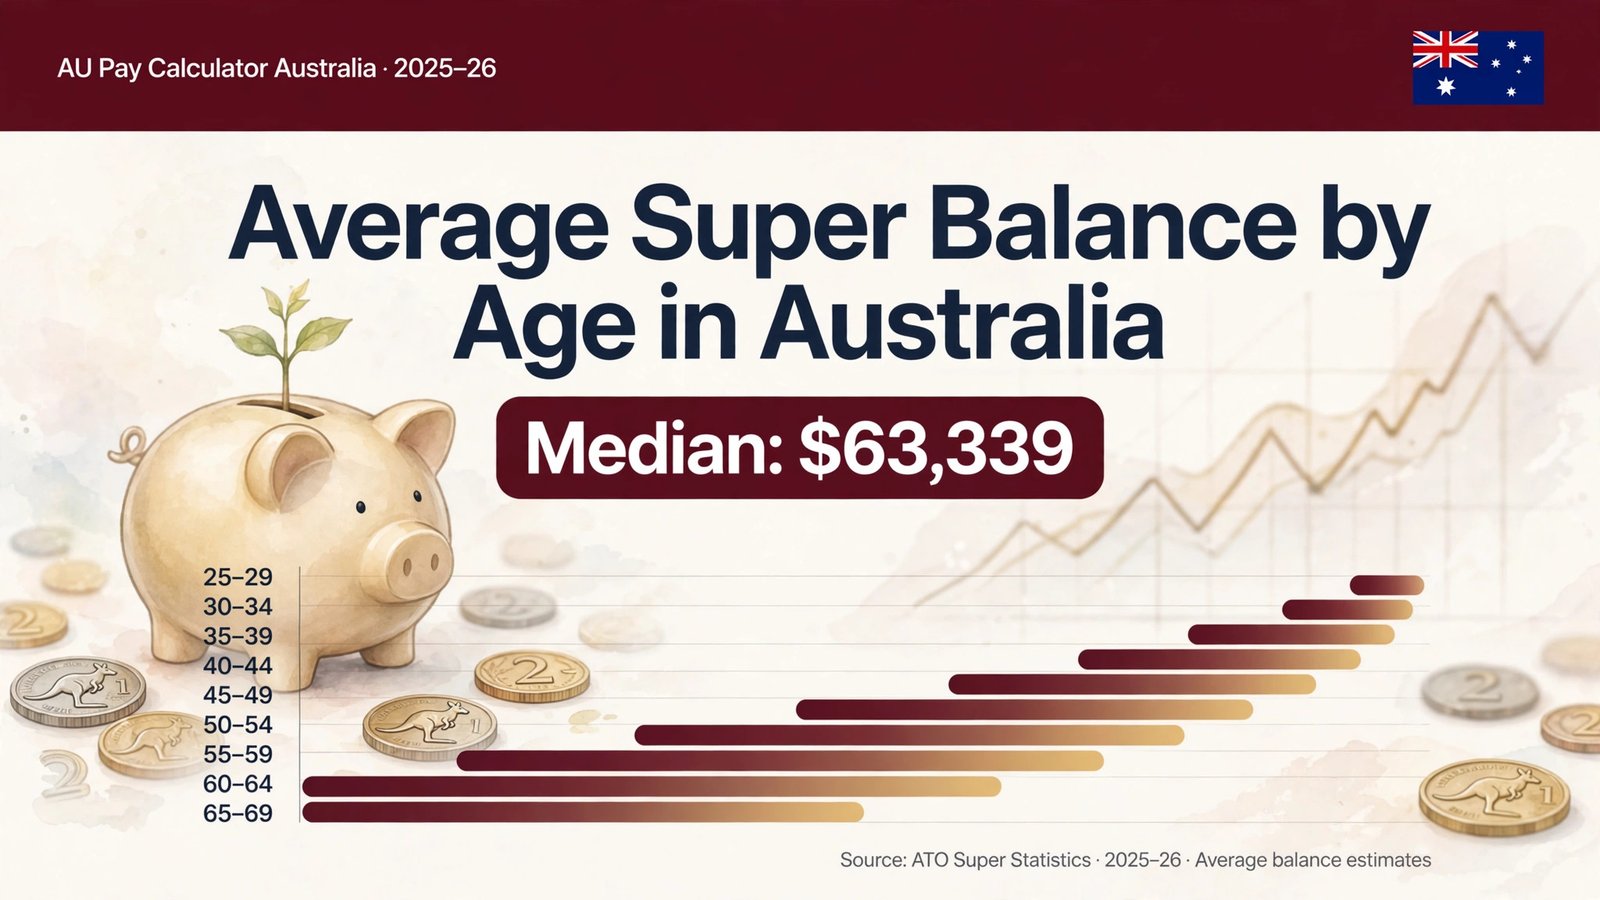
If you have ever looked up the average super balance by age in Australia and felt your stomach drop, you are not alone. The headline number — a national average of $182,781 per person — makes an awful lot of ordinary workers feel hopelessly behind. But most headlines never mention this: the average is not the right number to measure yourself against. The median super balance across all Australians is just $63,339, because a relatively small number of very large balances drags the average up by nearly three times.
This guide walks through the latest official figures from the ATO’s Taxation Statistics 2023–24 — every age band from under 18 to 75-plus, average and median side by side — then compares them with the on-track targets published by ASFA, the super industry body, so you can see honestly where you stand and what to do next.
Average vs Median: Which Number Matters?
The ATO gives two numbers for every age group: the mean (the “average”) and the median (the exact middle — half of people hold more, half hold less). Across all ages, the average of $182,781 sits roughly 2.9 times higher than the median of $63,339 — not a rounding quirk, but the whole story.
Why such a gap? Averages are pulled upward by outliers. A modest number of Australians hold seven-figure super balances — long-serving executives, professionals with decades of maximum contributions, or people who rolled large payouts into super. Their balances count equally when a mean is calculated, so the “average” ends up describing a person who barely exists: someone richer than the vast majority of Australians. The median, by contrast, is the honest personal benchmark. A 35-year-old with $70,000 in super looks behind on the average ($91,265 for her age band) but right on par on the median ($69,200). Same balance, two stories. Trust the median.
This skew is not unique to super — income and wealth data show the same pattern — but it matters more for super because the numbers are so widely quoted in retirement planning. Any time you see a super balance statistic, ask first: is this a mean or a median? If the article does not say, assume it is the flattering-but-misleading average, and mentally cut it by a half to two-thirds to get closer to the typical Australian experience.
Average Super Balance by Age: The Full Table
The figures below come from the ATO’s Taxation Statistics 2023–24, snapshot table 5, at 30 June 2024 — the most recent official benchmark available in 2026. They are per-person means and medians across all Australians with super.
| Age band | Average balance | Median balance |
|---|---|---|
| Under 18 | $6,890 | $307 |
| 18–24 | $9,783 | $6,071 |
| 25–29 | $27,822 | $21,395 |
| 30–34 | $54,009 | $40,426 |
| 35–39 | $91,265 | $69,200 |
| 40–44 | $134,054 | $100,330 |
| 45–49 | $182,866 | $131,705 |
| 50–54 | $238,616 | $161,375 |
| 55–59 | $301,151 | $185,120 |
| 60–64 | $371,379 | $203,326 |
| 65–69 | $437,422 | $218,631 |
| 70–74 | $492,903 | $227,982 |
| 75+ | $525,439 | $197,878 |
| All ages | $182,781 | $63,339 |
A few patterns stand out. The median roughly doubles between 40–44 ($100,330) and 60–64 ($203,326) — the payoff of decades of compounding. The gap between average and median also widens with age: by 70–74 the average ($492,903) is more than double the median ($227,982), because large balances have had longer to compound. And the 75-plus median dips to $197,878 — exactly what you would expect once retirees start drawing down their balances in pension phase.
Comparing yourself to the right column is the whole point of this exercise. Find your age band, read the median, and judge honestly. If you are above it, you are doing better than most Australians your age — whatever the scarier average says.
Are You on Track? ASFA Targets by Age
Knowing the median tells you where you stand relative to other Australians — but it does not tell you whether that is enough. For that, the standard benchmark comes from the Association of Superannuation Funds of Australia (ASFA), which publishes “on-track” targets: the balance you would want at each decade to be heading toward a comfortable retirement.
The targets below apply to someone earning around $75,000 a year — scale them roughly in proportion if you earn more or less, since the super guarantee is a percentage of pay. To see what your own salary translates into, our income tax calculator breaks down Australian pay including the super guarantee component.
| Age | ASFA on-track target (~$75k earner) |
|---|---|
| 30 | $44,500 |
| 40 | $146,000 |
| 50 | $282,500 |
| 60 | $466,000 |
Held against the ATO medians: at 30–34 the median is $40,426 versus a target of $44,500 — the typical Australian is only a few thousand short. By 40–44 the median is $100,330 against $146,000, and by 50–54 the median of $161,375 sits well below $282,500. The targets grow faster because ASFA’s “comfortable” standard is deliberately ambitious: a goal to aim at, not a description of the typical experience.
If you are 45 and sitting on the median $131,705, ASFA’s maths suggests you would want to be adding more than the mandatory super guarantee to reach its comfort standard by 67. The good news is that your fifties and early sixties are typically your highest-earning, highest-contributing years — and every extra dollar contributed then still has a decade or more to compound.
What a Comfortable Retirement Costs
ASFA also publishes the headline number quoted in retirement debates: how much you need at age 67 to fund a comfortable retirement as a homeowner. For singles, around $595,000–$630,000; for couples, around $690,000–$730,000. ASFA updates these each year, so treat them as current-year estimates rather than fixed totals.
“Comfortable” here has a specific meaning: ASFA’s Retirement Standard budgets for an annual domestic holiday, regular leisure, a reasonable car and top-level private health insurance — genuine financial ease, not luxury. A “modest” retirement, covering the basics, needs far less, with the Age Pension doing much of the heavy lifting.
Measured against the ATO medians, the challenge is real: the median balance for Australians aged 60–64 is $203,326 — well under half the single comfortable target. Most Australians retire with a blend of super, the Age Pension and home equity, which is why ASFA’s figures describe comfortable rather than typical. Knowing the gap exists is what lets you act on it: salary sacrifice, catch-up contributions, or simply checking that fund fees and insurance premiums are not quietly eating your returns.
The Super Gender Gap
The ATO’s statistics make one more pattern unmistakable: men hold higher average super balances than women at every single age band. The gap runs across the entire age spectrum, from the youngest workers to retirees drawing down their balances.
The causes are structural. Women are more likely to take career breaks or work part-time during the prime child-rearing years — precisely when compounding has the most time to work. The gender pay gap means the fixed-percentage super guarantee delivers smaller dollar contributions on lower pay. And lower lifetime earnings compound the disadvantage twice: less money going in, fewer dollars compounding over fewer years.
Removing the old $450-a-month super threshold — which once denied guarantee contributions to many casual and part-time workers, disproportionately women — targeted this gap, but the ATO data shows it persists in every age band. The national medians blend both sexes, so the female-typical experience is a fairer personal benchmark for women than the headline number — and catch-up contributions in your forties and fifties count double thanks to compounding.
Why Balances Grow So Fast After 40
The curve bends upward sharply from the forties: the median jumps from $100,330 at 40–44 to $161,375 at 50–54, then $203,326 at 60–64. That acceleration is the super guarantee working as designed — strengthened on 1 July 2025, when the Super Guarantee rate reached 12% of ordinary time earnings.
Three forces combine in those middle decades. First, contributions peak: earnings typically rise through the forties and fifties, and the guarantee is a percentage of pay, so the dollars landing in super each year grow with it. Second, the existing balance is finally large enough for compounding to matter — 12% SG on a $60,000 salary is $7,200 a year, but investment earnings on an existing $150,000 balance can add as much again with no extra contribution. Third, many Australians start salary-sacrificing or using catch-up concessional contributions in this phase, once family costs ease off.
This is why your forties and fifties matter so much: it is when super stops being a payslip line item and becomes a genuine wealth engine. Check your super yearly, consolidate duplicate accounts so fees stop multiplying, make sure you actually receive the full 12% from every employer (underpayment is depressingly common for casual and contract workers), and run your own numbers. Our super calculator projects your balance forward with your own salary, contribution rate and expected returns — so you can see exactly how the 12% guarantee compounds for you over the decades ahead.
Frequently Asked Questions
What is the average super balance in Australia in 2026?
The ATO’s Taxation Statistics 2023–24 (snapshot at 30 June 2024) put the average across all ages at $182,781 — but the median, the more honest personal benchmark, is just $63,339.
Should I compare myself to the average or the median?
The median. The average is pulled up by a small number of very large balances, so it describes someone richer than the vast majority of Australians. The median is the exact middle — half of people your age hold more, half hold less. It is the only fair way to judge where you stand.
What is a good super balance for my age?
ASFA’s on-track targets are the standard yardstick: for someone earning around $75,000, aim for roughly $44,500 at 30, $146,000 at 40, $282,500 at 50 and $466,000 at 60, scaling in proportion to your income. For a comfortable retirement at 67 as a homeowner, ASFA puts the target at around $595,000–$630,000 for singles and $690,000–$730,000 for couples.
Why is there such a big gender gap in super?
The ATO’s statistics show men hold higher average balances than women at every age band — driven by career breaks and part-time work in the high-compounding early years, the gender pay gap feeding into percentage-based contributions, and lower lifetime earnings overall. Catch-up contributions in your forties and fifties can help close the gap.
How much super should I have at 40?
The ATO median for the 40–44 band is $100,330, while ASFA’s target for a ~$75,000 earner is $146,000 at 40. Near the median means keeping pace with typical Australians; near the ASFA target means on the path to a comfortable retirement.
Does the 12% super guarantee make a big difference?
Yes — especially over time. At 12% of ordinary time earnings, a $60,000 salary puts $7,200 a year into super before investment returns. Over decades, that steady compounding is what drives the sharp balance growth visible in the ATO data from age 40 onward. Checking you actually receive the full 12% from every employer is one of the highest-value super habits there is.
Your Super, Your Next Step
The takeaway: the typical Australian holds far less super than the “average” suggests — a national median of $63,339 against an average of $182,781. Compare yourself to the median for your age band, mind the gap to ASFA’s targets, and remember your forties and fifties are when compounding does its heaviest lifting, with the guarantee now at 12%.
Knowing the national figures is useful; knowing your number is what changes things. Run your own salary, contributions and expected returns through our super calculator to see where your balance is heading — and what an extra 1 or 2% of salary sacrifice today could be worth by the time you are 67. It takes two minutes, and it is the most useful super comparison you will make all year.
Balance figures: ATO Taxation Statistics 2023–24 (snapshot at 30 June 2024); targets: ASFA.